Monitoring 101: How to monitor your solar production and battery performance
Monitoring 101: How to monitor your solar production and battery performance
Harnessing the sun’s power is only one part of the solar journey. The real adventure begins when you monitor and truly understand how your system performs day in and day out. Delving into the nitty-gritty of your solar production and battery performance offers insights, peace of mind, and a unique sense of achievement.
The Value and Importance of Monitoring Your Solar and Battery Performance
Both your solar panels and battery play integral roles in ensuring you reap the full benefits of your green energy system.
- Immediate feedback: There’s a certain thrill in seeing real-time energy figures, be it from the solar panels during a sunny day or from the battery as it powers your home after sunset.
- Making the most of your investment: Ensuring both the solar system and battery operate at peak performance is key. This vigilance guarantees optimal returns and longevity.
- Fun and Satisfaction: It’s not just about efficiency. Observing your system, from the panels’ response to varying weather conditions to the battery’s steadfast support, can be enlightening and satisfying.
- Maximising efficiency and longevity: Monitoring ensures that you’re drawing energy efficiently from the battery post-sunset, while also safeguarding the battery’s health for long-term use.
- Safety: A proactive approach to monitoring means you’re always ahead of potential issues, ensuring your home’s safety and system’s reliability.
Utilising the Data to Your Advantage
Tapping into the insights provided by your solar system transforms you from a passive consumer to an active participant in your energy journey. Here’s how you can make the most of this data:
- Optimised Energy Consumption: Understanding when your solar production is at its peak allows you to align energy-intensive tasks, like laundry or pool filtration, with these hours. This ensures you’re using solar power at its freshest, reducing dependence on the grid.
- Financial Benefits: By monitoring the data, you can gauge how much you’re saving daily, monthly, or annually. This can empower you to potentially adjust tariff plans with your energy provider or even consider selling excess energy back to the grid, where applicable.
- Maintenance Alerts: Regular dips or anomalies in the data can be early warning signs. Addressing these minor issues proactively can avert larger problems, ensuring your system remains efficient and your investment protected.
- Environmental Impact: Beyond the immediate benefits, the data provides a clear picture of your carbon footprint reduction. It’s a gratifying experience to see, in quantifiable terms, the positive environmental impact your household is making.
- Battery Usage Optimisation: With insights on how and when you’re drawing from your battery, adjustments can be made to ensure you’re using stored energy judiciously. This prolongs battery life and ensures you have power during crucial times, like during blackouts.
- Enhanced System Expansion: As you grow more accustomed to reading your system’s data, it can guide decisions for potential system expansions or enhancements. Maybe you’ll spot consistent energy excesses, guiding you towards adding more storage, or perhaps you’ll find room to expand your solar panel array.
Monitoring 101: Getting Started
If you want to stay on top of your solar energy production, the first and easiest step is to utilise/download the monitoring app for the brand of inverter you have. These apps allow you to easily monitor and manage your solar system from the convenience of your smartphone or tablet.
Download your inverter app here.
Once you’ve downloaded the app, connected your inverter to wifi and are ready to go – you’ll start seeing some numbers and graphs in your app and reports.
To start with, focus on understanding four key metrics:
- Power your system is making from the sun – the power currently being generated by your solar system.
- Power your home is currently using – the amount of power your home is currently using.
- Excess power currently being exported to the grid – the amount of power your system is exporting to the grid in exchange for feed-in tariff credits.
- Excess power currently being stored/or pulled from your battery – the amount of power your battery is storing/using or generating/being pulled out of your battery, if you have one.
Real-Time Monitoring
Here’s how those metrics look on a real-time report from Sungrows iSolarCloud app (a full guide on that app here): 
In this example the solar system is generating 10.2kW of power, the home is using 5.7kW of that, and the remaining 4.5kW is being exported back to the grid for feed-in tariffs. None of the power being generated us being used to power the battery as it’s already at 100% charge.
Here’s a different real-time look at those same four metrics with a Fronius Inverter through their Solarweb monitoring:

As you can see in that example the system is making 5.77kW of power from the sun, the home is currently using 3.28KW of power, meaning the home is being fully powered at the moment by solar/the sun. There is also an excess of 2.49kW of power being exported to the grid and sold for feed-in tariffs – if you had a battery that 2.49kW of excess power may have been used to charge the battery up (with free power from the sun) instead.
If you planned to run some appliances like a dishwasher, now could be the perfect time to do that as you’re generating more power than is being used, meaning you dishwasher power use could be free (as long as clouds don’t pop up straight after starting the dishwasher!).
Another example, this time from Sungrows iSolarCloud desktop monitoring shows a system generating 9.5kW, with 1.47kW being used by the home and 8.07kW being exported back to the grid. The battery in this case is 99.8% charged so no excess power is charging the battery:

Day Monitoring
Along with real-time monitoring you can also look at how performance went day by day, for example with a Fronius Inverter through their Solarweb monitoring:
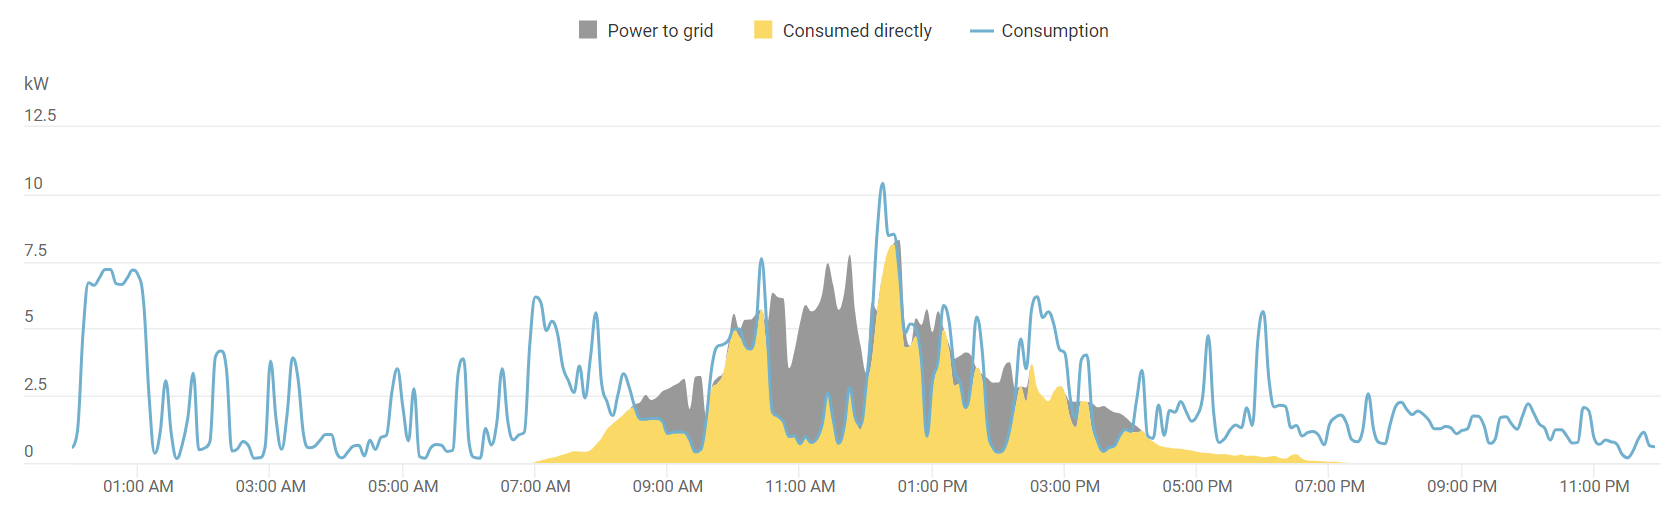
As you can see in this graph (with the KW used on the left of the graph), the blue line shows when the house was using power – throughout the night powering air conditioning/heating and other devices and then higher use through the day with the biggest blue spike around 12pm – possibly cooking lunch!
You can also see yellow and grey graphs – this is solar power being generated through the day starting when the sun came up around 7am, spiking in the afternoon and going through to 7pm when the sun went down.
The grey and yellow combined is the total amount of solar being generated. The difference being that yellow is power you used directly from your own solar production (ie, free power) and the grey being power you generated but didn’t use so sold back to the grid to earn feed-in tariffs.

If you’re using Sungrows iSolarCloud monitoring they also have a similar graph showing the days performance:
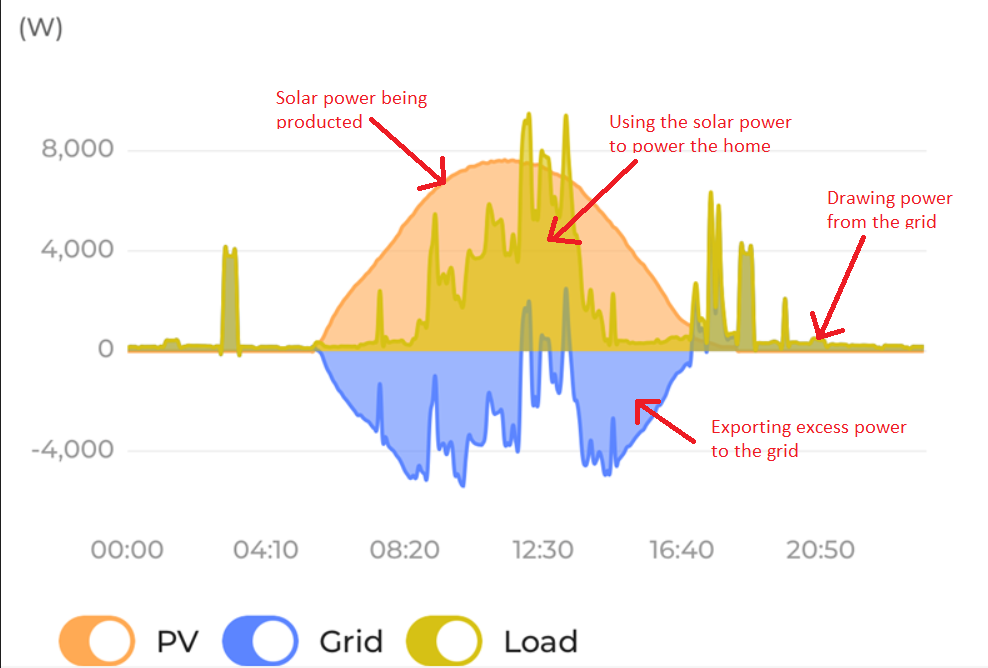
In this example you can see that almost all of the power used by the house during the day (in yellow) was free solar power produced by the solar system (in orange). There is also a lot of power being exported back to the grid (in blue) in exchange for feed-in tarriffs. With just some yellow spikes of power usage in the early evening outside of the orange area of solar power production – which would have been drawn/bought from the grid.
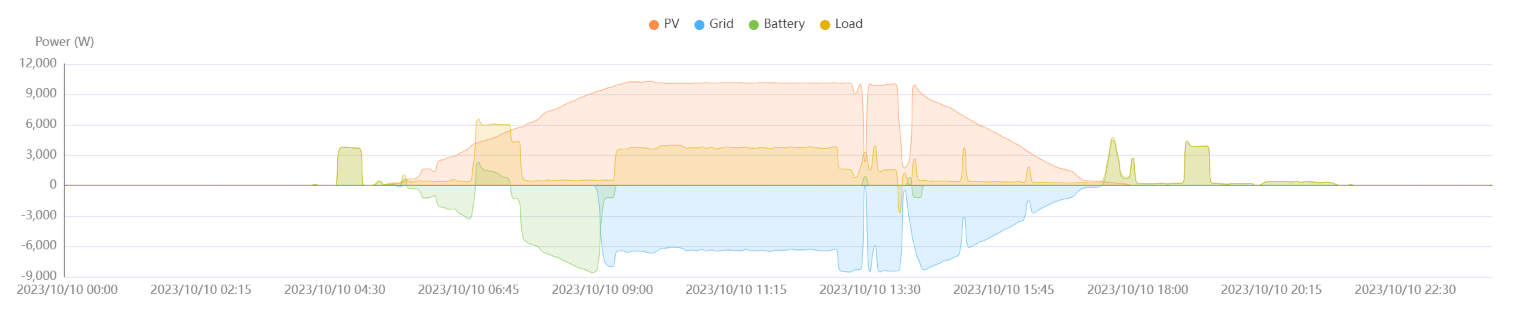
Another example of Sungrows iSolarCloud day monitoring shows a system with a battery – yellow showing the home using power through the day, orange showing the solar panels generating/making power and green showing excess power being sold back to the grid from the battery and blue showing excess power being sold back to the grid from the solar:
Delving Deeper: More Advanced Monitoring
If you’re enjoying and getting value out of your basic solar and battery monitoring you can take things a step further. Here are a few additional articles to help you learn and get ideas on more advanced monitoring:
- Different solar and battery monitoring system for your home: Find out about other ways you can monitor your solar and battery usage including through your energy provider, Uutilising third-party monitoring systems and even physical monitoring devices.
- Understanding solar and battery monitoring terms: delve deeper into reports offered in your apps and other monitoring systems and understand the terms being used and what they mean for your system performance.
By being data-savvy, Australian homeowners not only enhance their personal energy experience but also contribute to broader grid stability and a sustainable future. Every data point is a step closer to a more efficient and green home.